
Choosing Data Center Power Supplies in 2026 means looking beyond the wattage printed on a label. AI workloads can shift rapidly, and a rack’s demand may rise as new accelerators are installed. A supply that performs well at one load point may be less efficient at another. Check the expected load range, output stability, redundancy design, and compatibility with your distribution architecture. Small details matter: connector type, airflow direction, and service clearance can affect installation and maintenance.
Uptime Institute analyst Andy Lawrence has emphasized a useful principle: data-center efficiency should be assessed across the facility, not by judging one component alone. That perspective helps frame power-supply choices. Compare efficiency curves at realistic operating loads, not only peak ratings. Review telemetry features, fault alerts, and hot-swap procedures with the operations team. Ask vendors for test conditions and supporting documentation. A glossy efficiency claim is not enough.
The right choice depends on the site. A high-density deployment may prioritize power capacity and thermal behavior, while an established facility may value compatibility and reduced downtime. Consider redundancy carefully; extra capacity can improve resilience, but it can also add cost and losses. There is no universal winning model. Even a careful forecast can miss how quickly workloads change. Treat this guide as a decision framework, then verify each shortlisted Data Center Power Supplies option against measured demand, service requirements, and the facility’s electrical design.
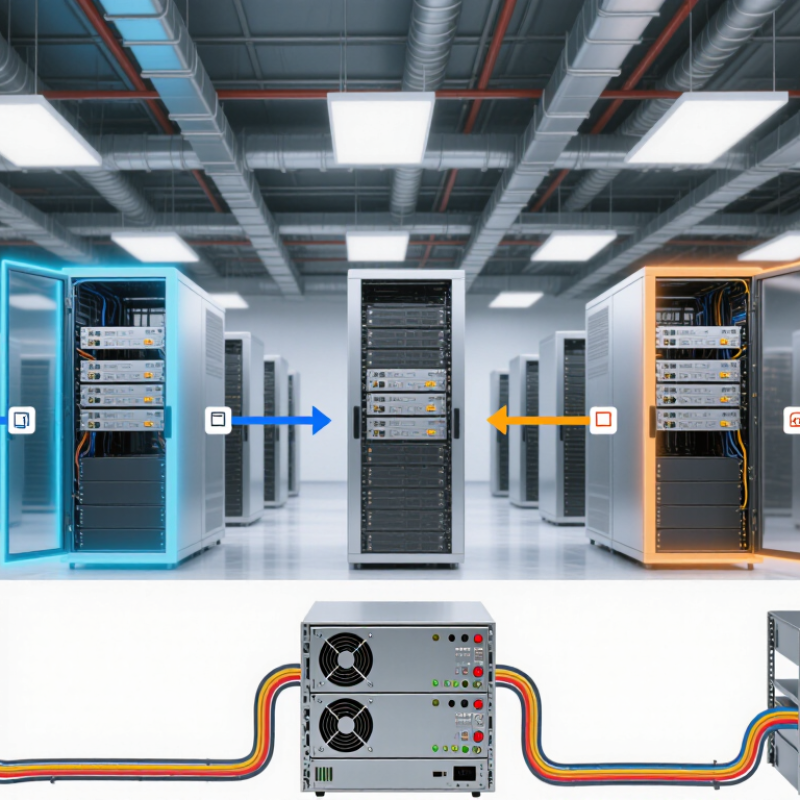
Choosing a data center power supply starts with measured demand, not a guess based on floor space. Record power at the rack level during normal operation and peak workloads. Include servers, storage, networking, and power conversion losses. A rack drawing 8 kW today may briefly draw more during batch processing or equipment startup. Check the readings over several weeks, not just one quiet afternoon.
Growth plans matter just as much. Map expected rack additions, higher-density equipment, and deployment dates for the next three to five years. Separate confirmed projects from optimistic forecasts; they are often treated as equally certain, which can lead to expensive overcapacity. Still, leaving no room for growth can force rushed electrical upgrades. That trade-off deserves honest review.
Then size the supply path around realistic peak demand and the chosen redundancy design. For an N+1 arrangement, verify that remaining units can carry the required load after one unit fails. Check how each supply performs at typical operating loads, since efficiency can change across its range. Allow for future capacity, but avoid sizing every component for a distant, uncertain maximum. Plans change. Revisit the numbers when new racks arrive, workloads shift, or measured demand differs from the forecast.
A data center power supply choice begins with the power path, not a headline efficiency figure. Centralized architectures can simplify equipment management, but a fault may affect a larger section of the facility. Distributed supplies place conversion closer to the load and can limit some fault domains, though they add components to monitor. Modular designs offer another trade-off: technicians can replace a module without redesigning the entire system, but only if access and service procedures are practical. Small details matter.
Capacity should reflect measured demand, expected growth, and operating conditions. Estimate peak load from real server configurations, then account for conversion losses, temperature, and the supply’s usable output. Avoid sizing every unit for a brief theoretical peak; that can leave equipment running inefficiently at low loads. Yet an overly tight estimate is risky. A spreadsheet can miss the extra draw from a workload change or a hot equipment row.
Redundancy needs a clear failure scenario. N+1 provides one spare unit beyond the required capacity, while 2N uses two independent paths, each designed to support the load. Neither label guarantees continuity if both paths share a breaker, cable route, or maintenance window. Check how the system behaves during a supply failure and a planned replacement. Test alarms, transfer times, and load sharing under realistic conditions. Perfect assumptions rarely survive contact with the room.
Use this comparison as a planning guide. Capacity, efficiency, and redundancy depend on equipment specifications, operating load, ambient conditions, and the required availability target.
| Power Architecture | Typical Power Path | Typical Capacity Planning Range | Common Redundancy Options | Advantages | Trade-Offs and Checks | Best-Fit Applications |
|---|---|---|---|---|---|---|
| Distributed AC with server-level power supplies | Utility or UPS output → rack AC distribution → one or more AC-to-DC power supplies in each server | Individual server modules commonly range from about 1 to 3.2 kW; higher-capacity models are available. Size rack feeds for measured or specified peak demand, not server count alone. | Dual power supplies connected to separate A and B feeds; commonly configured as 1+1 at the server level. | Familiar design; granular fault isolation; straightforward service and incremental deployment. | Many conversion stages and connections; verify that dual supplies are connected to independent power paths and that either feed can support the required load after a failure. | General-purpose data halls, mixed server fleets, and sites prioritizing modular replacement. |
| AC UPS with distributed rack power supplies | Utility → AC UPS → power distribution units → server AC-to-DC supplies | UPS systems are configured from modular or fixed-capacity units, from tens of kilowatts to megawatt-scale installations. Select capacity from the protected load plus planned growth and operating margin. | N, N+1, or 2N UPS configurations; dual-corded IT equipment can receive power from separate A and B systems. | Provides backup power and power conditioning; broadly compatible with conventional AC-powered IT equipment. | Account for UPS output rating, battery runtime, recharge requirements, bypass arrangements, and the load remaining after a module or path failure. | Facilities requiring ride-through or generator-supported backup with conventional AC distribution. |
| Centralized 48 V DC plant | AC input → modular rectifiers → DC bus and battery system → 48 V distribution → DC-powered IT equipment | Rectifier plants are built from multiple modules; total system capacity ranges from cabinet-scale installations to larger room-level systems. Confirm supported input, bus voltage range, and load current with equipment specifications. | N+1 rectifier modules; independent A and B DC feeds where the IT equipment supports dual inputs; battery strings may be arranged for required backup duration. | Can reduce conversion stages for compatible equipment; modular rectifiers allow capacity to be added in increments. | Low-voltage DC requires high current: at 48 V, 10 kW is about 208 A before losses. Verify busbar, cable, connector, protection, voltage-drop, and service requirements. | Purpose-designed environments with compatible DC loads and suitable high-current distribution infrastructure. |
| Rack-level power shelf or integrated power system | Rack AC or DC input → shared, hot-swappable power modules → rack-level distribution → IT equipment | Capacity is determined by the installed module count and the rack’s distribution limit. Commonly used for high-density racks; check both continuous output and per-branch limits. | N+1 power modules; separate A and B inputs or shelves where the design and equipment support independent paths. | Centralizes module servicing and monitoring at the rack; can simplify power scaling for a standardized rack design. | Creates shared rack-level components; check module failure behavior, busbar ratings, connector compatibility, and whether a single fault can affect multiple servers. | Standardized high-density racks and deployments with consistent, compatible IT hardware. |
| Direct high-voltage DC distribution | AC input → rectification and DC protection → higher-voltage DC distribution → compatible downstream conversion | Capacity is project-specific and depends on the conversion equipment, distribution design, and supported IT loads; do not assume equipment accepts a particular DC input without written specifications. | Redundant conversion modules and distribution paths can be designed, but protection and fault isolation must be engineered for the selected DC voltage. | May reduce current and distribution losses compared with low-voltage DC at the same power, depending on the complete system design. | Compatibility, protection, switching, maintenance procedures, and electrical-code requirements need careful validation; ecosystem support varies. | Purpose-engineered projects where compatible loads and qualified design, operations, and service support are available. |
Capacity check: Estimate the coincident IT load, add planned growth, and verify the maximum load supported after the intended failure (for example, one UPS module or one power path). For a simple N+1 module design, usable capacity after one module is unavailable is approximately (module count − 1) × module rating; apply equipment derating and the project’s operating limits.
Choosing data center power supplies in 2026 means looking beyond peak-efficiency labels. Check conversion efficiency at the rack’s normal load, including during redundant operation. Small losses compound. Uptime Institute’s 2024 Global Data Center Survey reported an average facility PUE of 1.56. PUE includes cooling and electrical distribution; it does not measure PSU efficiency alone.
Thermal performance deserves the same scrutiny. Compare units under similar inlet temperatures and airflow conditions, then check fan behavior, operating limits, and heat output at typical loads. A clogged filter or warm aisle can change real-world results. Measure, don’t assume. The U.S. Department of Energy’s 2024 data center energy report estimated consumption at 176 TWh in 2023, with demand potentially reaching 325–580 TWh by 2028. That scale makes small efficiency differences financially meaningful.
Estimate operating costs using local electricity rates, expected load, redundancy settings, and service life. Ask for efficiency curves across several load levels, not just one headline figure. Include cooling energy, replacement labor, and the cost of downtime in the comparison. A spreadsheet can still miss the mark if actual server utilization changes. Verify assumptions against rack-level power readings after deployment, and revisit them as workloads shift.
Evaluate efficiency, thermal performance, and operating costs
What the chart shows: At 230V, higher-efficiency supplies waste less energy as heat. At a continuous 10 kW output, the 100%-load certification thresholds imply approximately 1.24 kW of conversion losses for Gold, 1.11 kW for Platinum, and 0.64 kW for Titanium.
These are minimum 230V EU certification thresholds, not guaranteed performance curves for every unit. The heat and cost impact depends on the actual load profile, cooling overhead, electricity rate, and power-supply configuration. For illustration, at $0.12/kWh and 8,760 hours per year, those full-load losses would cost roughly $1,299, $1,169, and $671 annually, respectively.
When selecting data center power supplies in 2026, start with documented safety and electrical compatibility. Ask for current test reports against applicable standards, such as IEC 62368-1, and confirm the exact model and configuration are covered. A certificate for a similar unit is not enough. Check input voltage, frequency, connector type, protection settings, and load behavior against your rack and backup-power design. Test alarms and failover under realistic load, not only at idle. Small differences matter.
Efficiency deserves close scrutiny as power demand rises. The International Energy Agency’s Energy and AI report estimates data centers used about 415 TWh of electricity in 2024 and may use around 945 TWh by 2030. Compare efficiency curves at your expected operating load, not just peak ratings. Also review heat output, acoustic limits, and service clearances. A promising efficiency figure can disappoint if the unit runs far below its rated load.
Supplier support is part of the specification. Request response-time commitments, replacement-unit availability, firmware change records, and clear escalation routes. Ask how faults are diagnosed and what telemetry is retained. Then verify the answers with a small pilot or reference checks. Paperwork can look complete. Real support is harder to measure. I would still leave room for doubt: service promises mean little until tested during a real fault.
Before ordering, map the power supply to the room, not just the equipment list. Check input voltage, phase, rack space, airflow direction, connector types, and the expected load at peak demand. Leave room to work. A few centimeters of clearance can make cable checks and replacement much easier. Confirm that redundant units use separate power paths where the site design allows it. During installation, label both ends of each cable and record the circuit assignments. Small details matter. Have qualified technicians follow equipment instructions and site procedures, especially when working near energized systems.
Monitoring should show more than whether a unit is on. Track load, temperature, alarms, and changes in input or output readings. Compare trends across similar racks; one unusually warm unit may point to blocked airflow or uneven loading. Keep the data useful, not overwhelming. Maintenance can include reviewing alarm history, checking visible connections during approved service windows, and cleaning filters or vents as instructed. I would not assume a forecast stays accurate: new servers, changing workloads, and seasonal cooling demands can shift power needs. Plan upgrades with spare capacity, rack space, compatible connections, and enough time for testing under load. Test under load. A carefully documented baseline makes later changes easier to assess.
Request current test reports for the exact model and configuration. Similar-unit paperwork is not enough. Check applicable safety standards.
Compare input voltage, frequency, phase, connectors, protection settings, and load behavior with the site design. Test alarms and failover under realistic load.
Review efficiency curves at your expected operating load, not only peak ratings. Also check heat output, noise, and service clearances. Figures can mislead.
Ask about response times, replacement availability, firmware records, fault diagnosis, retained telemetry, and escalation routes. Test support through a small pilot if possible.
Measure rack space, airflow direction, cable reach, and working clearance. Label both ends of each cable and record circuit assignments. Details matter.
Where the site design allows, use separate power paths for redundant units. Confirm the arrangement matches backup-power plans.
Track load, temperature, alarms, and input and output readings. Compare similar racks. One warm unit may indicate blocked airflow or uneven loading.
Review alarm history and follow approved service instructions for visible connections and vents. Keep spare capacity, rack space, and compatible connections. Test changes under load. Plans can drift.
Choosing Data Center Power Supplies in 2026 starts with understanding both current demand and expected growth. Assess the load of servers, networking equipment, cooling systems, and other critical infrastructure, then allow room for future expansion. Compare power supply architectures, capacity options, and redundancy configurations to find an arrangement that supports reliable operation without adding unnecessary complexity.
Efficiency and thermal performance affect both operating costs and cooling needs, so evaluate how each option performs under realistic workloads. Confirm that equipment meets relevant safety requirements and is compatible with existing systems, and consider the quality of supplier support. Before installation, plan for monitoring, routine maintenance, and clear procedures for addressing faults. A forward-looking upgrade strategy can also make it easier to increase capacity or improve efficiency as the data center evolves.